Cite as: Davis, Daniel. 2014. “Quantitatively Analysing Parametric Models.” International Journal of Architectural Computing 12 (3): 307–319.
Abstract
Architectural practices regularly work with parametric models, yet almost nothing is known about the general properties of these models. We do not know how large a typical model is, or how complicated, or even what the typical parametric model does. These knowledge gaps are the focus of this article, which documents the first large-scale quantitative parametric model survey. In this paper three key quantitative metrics – dimensionality, size, and cyclomatic complexity – are applied to a collection of 2002 parametric models created by 575 designers. The results show that parametric models generally exhibit a number of strong correlations, which reveal a practice of parametric modelling that has as much to do with the management of data as it does with the modelling of geometry. These findings demonstrate the utility of software engineering metrics in the description and analysis of parametric models.
1. Introduction
Our current understanding of parametric modelling is largely confined to firsthand accounts of individuals working with specific parametric models. These accounts have proved useful both in illustrating new methods of parametric modelling (such as [1, 2]) and in demonstrating the application of parametric modelling in practice (such as [3, 4]). In these previous studies, the subject of investigation has often been exceptional parametric models – the models worthy of study because they constitute a novel method of working or an original application. This focus on the exceptional has left significant gaps in our understanding of the ordinary. Many basic questions have either gone unasked or unanswered. For instance, we do not know how large a typical model is, or how complicated, or even what the typical parametric model does.
Software engineers have asked similar questions of the computer programs they write. In an attempt to understand software quality, software engineers have invented numerous quantitative methods for evaluating various aspects of their code. In the following pages I take three key quantitative metrics from software engineering – size, dimensionality, cyclomatic complexity – and explain their applicability to parametric modelling. I use these metrics to measure 2002 parametric models created by 575 designers. By aggregating these measurements together I am able to identify general trends in the sampled population that help reveal the customary practices of parametric modelling.
2. Quantifying Software Engineering
For decades software engineers have sought to study computer code with elegant, repeatable, statistical studies [5]. A significant product of this prior research has been the formalisation of key metrics for measuring software quality. There are at least twenty-three unique measures of software quality categorised in the Compendium of Software Quality Standards and Metrics [6], and over one hundred in the ISO/IEC 9126 standard for Software Product Quality [7]. Together these metrics constitute a vocabulary of software quality that software engineers commonly use for project planning, cost estimation, quality assurance, defect identification, the management of programmers, and software engineering research [8]. Two particularly fundamental metrics are the measurement of code size using the lines of code, and the measurement of code complexity with McCabe’s cyclomatic complexity measure [8]. Since digital parametric models are essentially a type of computer program [9], there is reason to suspect that the metrics software engineers use to quantify code quality may also be applicable to architects wanting to measure their parametric models. Of particular interest are the measurements of code size (both lines of code and dimensionality) as well as code complexity (cyclomatic complexity). These metrics constitute the focus of this article.
3. Method
Quantitative metrics have never been applied to a large group of parametric models. This is probably because it has been difficult for architectural researchers to amass large, representative collections of parametric models. Instead, researchers generally only have access to parametric models created by themselves or their colleagues, which is a sample too idiosyncratic to draw any general conclusions from. The problem of gathering a collection of parametric models has been somewhat solved by the advent of websites enabling communities of designers to share parametric models publicly. One such website is McNeel’s Grasshopper online forum (grasshopper3d.com) where, between 8 May 2009 and 22 August 2011, 575 designers shared 2041 parametric models.
The collection of parametric models on the Grasshopper forum is not entirely representative. Most evidently, there are no models created in parametric modelling software other than Grasshopper. Numerous studies have shown that the modelling environment influences the model produced [10-13]. Even if the designer has a degree of agency that ensures the model is not entirely the product of its environment, it must be assumed that the collection of Grasshopper parametric models is not entirely representative of models created in other modelling environments. A further complication is that the models uploaded to the Grasshopper forum often focus on specific problems or solutions (generally architectural problems and solutions), which means they can often be simplifications of larger models. The implications this presents are discussed along with the results in each of the following sections of this article. Even though the collection of 2041 Grasshopper models is not a perfectly representative collection, it is a significant advancement over any previous study to be able to analyse how hundreds of designers organise models created in one popular parametric modelling environment.
To analyse the parametric models from the Grasshopper forum, I first download the 2041 models. The oldest model was from 8 May 2009 and created with Grasshopper 0.6.12, and the most recent model was from 22 August 2011 and created with Grasshopper 0.8.0050. All the models were uploaded to the forum in the proprietary .ghx file format. I reverse engineered this format and wrote a script that extracted the parametric relationships from each file and parsed them into a directed acyclic graph. Thirty-nine models were excluded in this process, either because the file was corrupted or because the model only contained one node (which distorted measurements like cyclomatic complexity). The graphs of the remaining 2002 models were then each evaluated with the quantitative metrics discussed in the remainder of this article. The measurements were then exported to an Excel spreadsheet and analysed. In the analysis I have favoured using the median since the mean is distorted by a few large outliers. Each of the key quantitative metrics is discussed in the following sections.
4. Size
Code size is one of the critical measures of software quality. Software engineers commonly measure a program’s size by counting the lines of code (LOC). This is a quick calculation that proves useful in understanding the software’s relative size. Barry Boehm’s seminal work on the economics of software engineering demonstrates that LOC is correlated with development effort [14]. In other words, programs with more LOC generally take more time to produce. Boehm uses this correlation as the basis for the COCOMO estimation method, which suggests that the months required to develop a typical project is roughly equivalent to 2.4 × KLOC1.06 (where KLOC is thousands of LOC) [14]. Other research has shown that the LOC measurement correlates highly with both code complexity [15], and the number of coding errors (more lines of code provide more opportunities for things to go wrong) [16]. These correlations make the LOC measure a valuable instrument for quickly establishing a project’s size and estimating its potential cost, complexity, and error proneness.
While the LOC measure is quick to calculate, it is also crude. Steven McConnell has said “the LOC measure is a terrible way to measure software size, except all other ways to measure size are worse” [17]. The major limitation of the LOC measure is that it doesn’t take into consideration the programming language or the programming style. A program may take up more or fewer lines of code depending on who programmed it and what programming language they used. For this reason, orders of magnitude matter more than the exact LOC measurement, with software engineers often rounding the LOC to the nearest thousand.
In a visual programming language like Grasshopper, a node can be considered roughly equivalent to a line of code (but given the differences between textual lines of code and visual nodes, direct comparisons generally cannot be made between the sizes of textual and visual programs). The size of a Grasshopper model can therefore be measured by simply counting the number of nodes in the model.
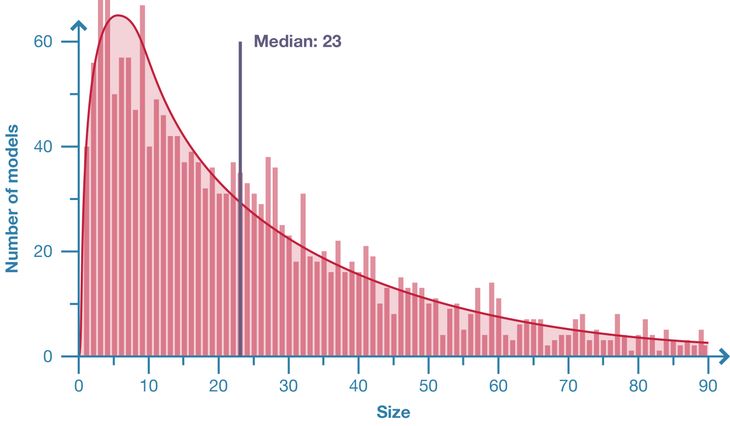
Figure 1: Distribution of model size in population of 2002 Grasshopper models.
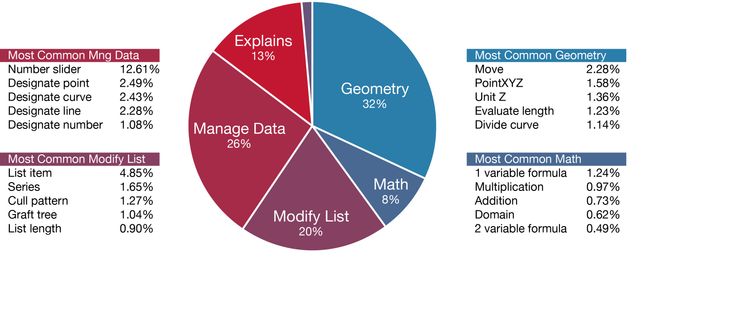
Figure 2: Typical function of nodes in population of 2002 Grasshopper models.
5. Dimensionality
An important subset of a parametric model’s overall size is the size of the inputs (the number of nodes without parents). This tally of the model’s parameters is termed the dimensionality since it determines the number of dimensions in the model’s search space. Ideally a model has a dimensionality large enough that the designer can change the model by changing a parameter instead of changing the underlying structure of the model. A high dimensionality would therefore seem desirable since it gives the designer more parameters to work with. But parameters come at a cost. They require work upfront to implement, and they require even more work to change. This investment may not pay off if the parameter is rarely used. Therefore, the skill of creating a parametric model is getting the balance right between too much and too little flexibility; between a large dimensionality and a small one [18].
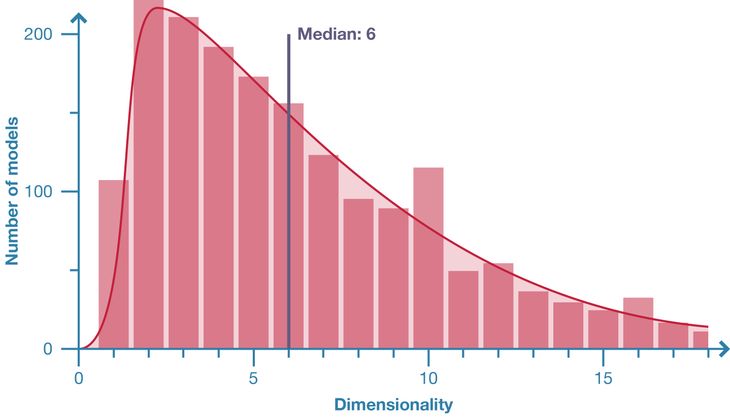
Figure 3: Distribution of model dimensionality in population of 2002 Grasshopper models.

Figure 4: Top: A directed acyclic graph comprised of a single path, which gives it a cyclomatic complexity of one. Bottom: A graph with the same number of nodes as the top model but with three distinct paths (each colour coded). This graph therefore has a cyclomatic complexity of three.
Cyclomatic complexity is a core software engineering metric for measuring code structure. The metric works by decomposing textual code into a graph and then counting the number of independent paths through the graph (Grasshopper models are already a graph, which makes them ideally suited for this metric). The number of paths is important since it indicates how much work is involved in understanding a piece of code. For instance, a graph that comprises of a single sequence of nodes can be understood by reading sequentially along the line (Figure 4). But understanding a more complicated graph, where chains of nodes diverge and converge back together, requires simultaneously reading many different paths (Figure 4). This becomes evermore difficult as the number of paths increases. A high cyclomatic complexity therefore indicates that a piece of code has a high number of independent paths, which potentially requires more cognitive energy to understand.
The original cyclomatic complexity formula is as follows [19]:

Where:
- G: the graph.
- e: number of edges (connections between nodes).
- n: number of nodes.
- p: number of independent graphs.
This formula assumes the graph has only one input node and one output node, which is infrequently the case with parametric models. In an appraisal of common modifications to the original formula, Henderson-Seller and Tegarden show that “additional (fictitious) edges” can be introduced to deal with multiple inputs and outputs [20]. In these circumstances, the cyclomatic complexity formula becomes:

Where:
- i: number of inputs (dimensionality).
- u: number of outputs.
- While assuming that there is only one graph (p = 1).
In the Grasshopper models I counted parallel edges between identical nodes (duplicate edges) as a single edge and I did not count non-functional nodes such as comments in text boxes.
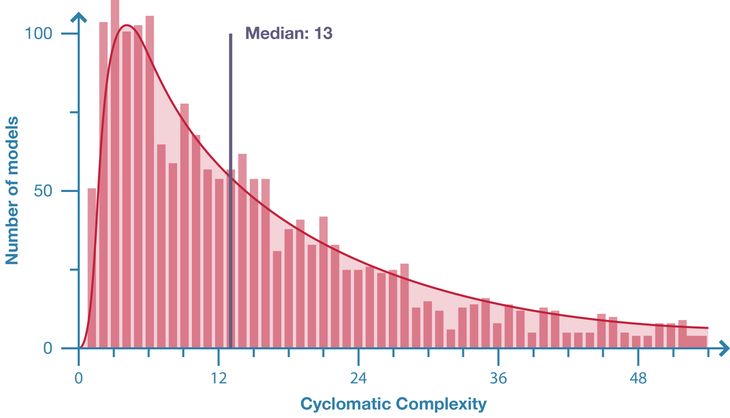
Figure 5: Distribution of model cyclomatic complexity in population of 2002 Grasshopper models.
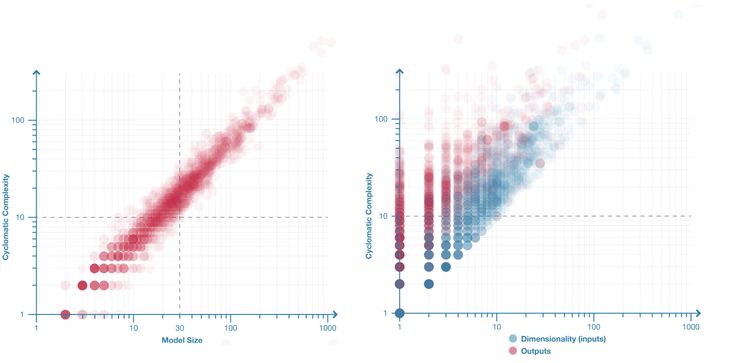
Figure 6: Left: Model complexity plotted against size for 2002 parametric models. These two factors are strongly correlated. Right: Model complexity plotted against dimensionality and number of outputs for 2002 parametric models. The distribution shows inputs correlate more highly with complexity (the blue dots are more linear and less vertically spread) than outputs (the vertical spread of red dots).
McCabe recommends restructuring any code with a cyclomatic complexity greater than ten [19], a number that has been reaffirmed by many subsequent studies [21]. Essentially, large, complicated programs should get restructured into smaller, simpler modules [19]. Grasshopper supports such modularisation using the cluster feature [22]. Of the sampled models, 1553 were created in a version of Grasshopper that supported clusters (either below version 0.6.12 or above version 0.8.0). Of these, only 39 contained one or more clusters – 97.5% were unstructured. Even if the definition of structure is expanded to include models that are organised without the clusters feature, 48% of models have no clusters, no groups, no explanation of what they do, and no naming on any of the parameters: by even the most generous of definitions these models are completely unstructured. In this context – with architects creating parametric models that are generally unstructured – complexity seems an inevitable by-product of model size. Complexity may even a limiting factor in the scale of parametric models, particularly if large models are always highly complicated.
7. Discussion
This research has demonstrated that three metrics borrowed from software engineering – size, dimensionality, and cyclomatic complexity – can be used to analyse parametric models. A potential direction for subsequent research would be the application of other software engineering metrics to parametric models. There are hundreds of potential candidates [6, 7], although many metrics will not be suitable since they are too specific to software engineering (in the ISO/IEC 9126 standard for Software Product Quality there are metrics for everything from ‘ease of use of help system’ to ‘I/O devices utilisation satisfaction’ [7]). Of those potentially suitable, three promising quantitative metrics are construction time, modification time, and latency. I suspect there are many more.
While this research has looked at quantitative measures of code, software engineers also use a variety of qualitative measures. Bertrand Meyer defines “software quality” as having ten qualitative aspects: correctness, robustness, extendability, reusability, compatibility, efficiency, portability, ease of use, functionality, and timelessness [23]. For software engineers, these terms become a vocabulary through which they can begin to describe the nuances of what makes their code successful. There is certainly potential for architects to borrow from software engineering in order to develop a more rigorous vocabulary, quantitative and qualitative, to further describe parametric models.
Another direction for future research would be in the application of these metrics to the practice of architecture. In software engineering, attempts to use quantitative metrics to manage programmers have largely failed. Paying a programmer based on how many lines of code they produce doesn’t make them write faster but instead tends to incentivise them to write longer programs. Having said that, software engineers have developed a number of management techniques to help generate better code in practice. At CASE we have been experimenting with one method, agile development, in the production of design documents. The research is too preliminary to definitively report upon, but early results suggest that there is significant potential to quantitatively improve the quality of architectural work through the management practices of software engineers.
8. Conclusion
This study is an important first step towards understanding the properties and variations of a typical parametric model. The 2002 Grasshopper models surveyed show that parametric models are generally small and complex. The average model contains twenty-three nodes and even the largest models, with just over one thousand nodes, are modest in the context of software engineering. The size of the model is strongly correlated with the model’s complexity, which tends to be very high overall. While one may intuitively expect that the majority of a parametric model consists of parameters and geometry, this study shows that organising the graph and managing data are often the most common components of parametric models created in Grasshopper. Parameters tend to be used surprisingly sparingly, with the vast majority of models only containing between one and eleven parameters.
Another important outcome from this survey is the validation of the three quantitative metrics. The study demonstrates that nodes are a good proxy for a model’s size and that the dimensionality can reveal unintuitive insights regarding the use of parameters in parametric models. Furthermore, the cyclomatic complexity seems to fairly accurately differentiate between simple and complex models. These three quantitative metrics are some of the first words in an emerging vocabulary for articulating the qualities of parametric models. Hopefully this vocabulary will allow us to move our discussion of parametric modelling beyond discussions of individual models and into discussions of how populations of models relate and compare to one another.
Acknowledgements
This research was carried out as part of my PhD at RMIT University, Melbourne. My supervisors, Mark Burry and Jane Burry, both helped in setting the direction for this research. The research was funded by the Australian Research Council discovery grant “Challenging the Inflexibility of the Flexible Digital Model”, which was led by Mark Burry and Jane Burry.
References
- Williams, C., The analytic and numerical definition of the geometry of the British Museum Great Court Roof, in: Burry, M., Datta, S., Dawson, A., Rollo, A., eds., Mathematics Design, Deakin University, Geelong, 2001, 434-440.
- Eigensatz, M., Kilian, M., Schiftner, A., Mitra, N., Pottmann, H., and Pauly, M., Paneling Architectural Freeform Surfaces, ACM Trans. Graphics, 2010, 29(4).
- Burry, M., Parametric Design and the Sagrada Família, Architectural Research Quarterly, 1996, 1(Summer), 70–80.
- Holzer, D., Hough, R., and Burry, M., Parametric Design and Structural Optimisation for Early Design Exploration, International Journal of Architectural Computing, 2007, 5(4), 625–644.
- Menzies, T., and Shull, F., The Quest for Convincing Evidence, in Oram, A. and Wilson, G. eds., Making Software: What really works, and why we believe it, California, O’Reilly Media, 2010, 3–11.
- Lincke, R., and Lowe, W., Compendium of Software Quality Standards and Metrics, Self published, 2007.
- International Organisation for Standards, ISO/IEC 9126: Information Technology – Software Product Quality, 2000.
- Möller, K., and Paulish, D., Software Metrics: A Practitioner’s Guide to Improved Product Development, London, Chapman & Hall, 1993.
- Dino, İ., Creative Design Exploration by Parametric Generative Systems in Architecture, METU Journal of Faculty of Architecture, 2012, 29(1), 207–224.
- Janssen, P., and Chen, K., Visual Dataflow Modeling : A Comparison of Three Systems, in Leclercq, P., Heylighen, A., and Martin, G., eds., CAAD Futures, Liège: Les Éditions de l’Université de Liège, 2011, 801–816.
- Leitão, A., Santos, L., and Lopes, J., Programming Languages for Generative Design: A Comparative Study, International Journal of Architectural Computing, 10(1), 2012, 139–162.
- Celani, G., and Vaz, C., CAD Scripting And Visual Programming Languages For Implementing Computational Design Concepts: A Comparison From A Pedagogical Point Of View, International Journal of Architectural Computing, 10(1), 2012, 121–138.
- Davis, D., Burry, J., and Burry, M., Yeti: Designing geometric tools with interactive programming, in Chen, L., Djajadiningrat, T., Feijs, L., Fraser, S., Kyffin, S., and Steffen, D., eds., Meaning, Matter, Making: Proceedings of the 7th International Workshop on the Design and Semantics of Form and Movement, Wellington, Victoria University of Wellington, 2012, 196–202.
- Boehm, B., Software Engineering Economics, New Jersey, Prentice-Hall, 1981.
- Van der Meulen, M., and Revilla, M., Correlations between Internal Software Metrics and Software Dependability in a Large Population of Small C/C++ Programs, in The 18th IEEE International Symposium on Software Reliability, Sweden, IEEE Computer Society Press, 2007, 203–208.
- El Emam, K., Benlarbi, S., Goel, N., and Rai, S., The Confounding Effect of Class Size on the Validity of Object-Oriented Metrics, IEEE Transactions on Software Engineering, 27(7), 2001, 630–650.
- McConnell, S., Software Estimation: Demystifying the Black Art, Redmond, Microsoft Press, 2006.
- Scheurer, F., and Stehling, H., Lost in Parameter Space? Architectural Design, 81(4), 2011, 70–79.
- McCabe, T., A Complexity Measure, IEEE Transactions on Software Engineering, 2(4), 1976, 308–320.
- Henderson-Sellers, B., and Tegarden, D., The theoretical extension of two versions of cyclomatic complexity to multiple entry/exit modules, Software Quality Journal, 3(4), 1994, 253–269.
- Watson, A., and McCabe, T., Structured Testing: A Testing Methodology Using the Cyclomatic Complexity Metric, Gaithersburg, National Institute of Standards and Technology, 1996.
- Davis, D., Burry, J., and Burry, M., Understanding Visual Scripts: Improving collaboration through modular programming, International Journal of Architectural Computing, 9(4), 2011, 361–376.
- Meyer, B., Object-Oriented Software Construction, New Jersey, Prentice-Hall, 1997.