Update: The argument in this blogpost appears with better graphs and more context in chapter two of my PhD thesis.
I have begun writing my PhD, which is simultaneously daunting and invigorating. Central to my writing at the moment is the question of why we want flexible representations, why architects need parametric models.
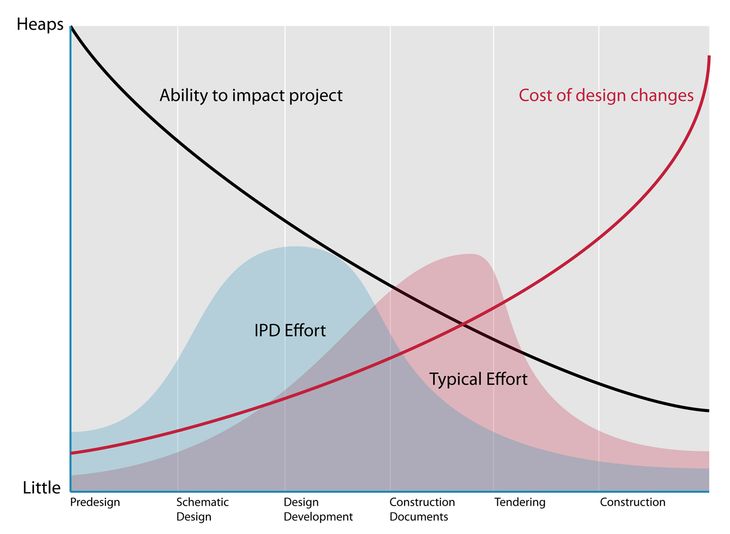
MacLeamy curve (2004)
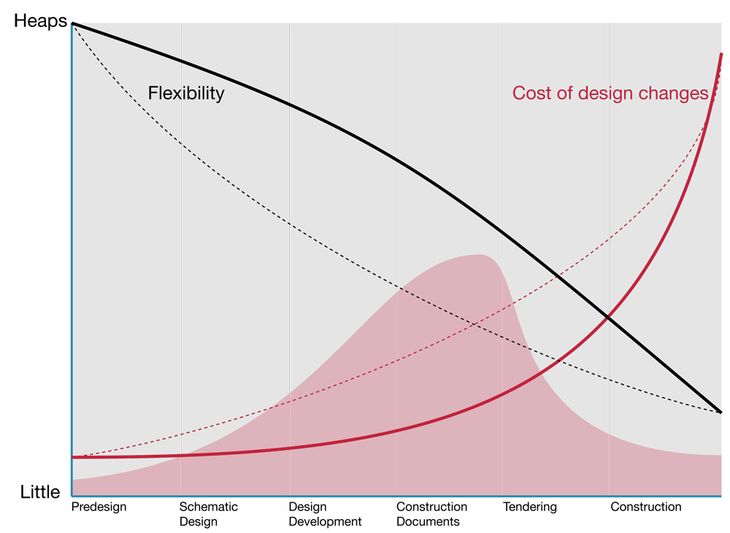
In 2004, Patrick MacLeamy drew a set of curves based on a pretty self-evident observation: an architectural project becomes more difficult to change the more developed it becomes. For this earth-shattering revelation MacLeamy named the curve after himself (although the title should probably go to Boyd Paulson who drew the curve much earlier [see Noel's comment to this post]). You have probably seen the graph before. It gets trotted out in every slide deck promoting BIM / IPD / or early-stage environmental analysis. The key point is that architects expel their effort at a time when design changes are relatively costly. MacLeamy and his disciples advocate shifting design effort forward in the project, frontloading it, in order to reduce the cost of design changes.
MacLeamy would argue that shifting design effort forwards is for the benefit of design [via youtube]. However, the portfolio of buildings the architecture firm HOK has designed with MacLeamy as CEO is decidedly uninspiring. MacLeamy's real design position is indicated by his choice to measure design changes in terms of cost since most designers would perceive their decisions as adding value to a project. Further, the shift in effort assumes the design process can be anticipated, and the design problem can be known before the design commences. But we have seen this curve before...
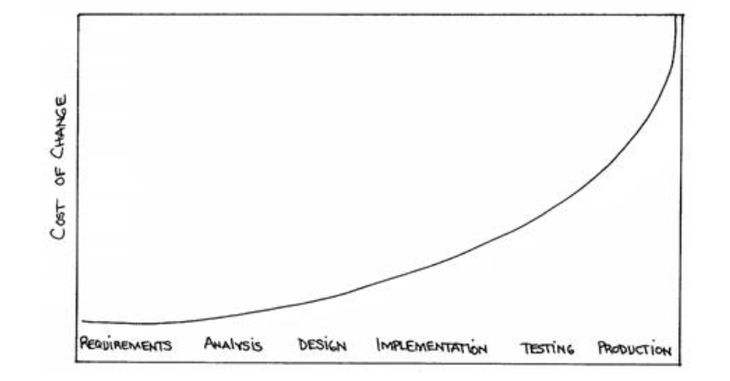
Boehm's curve (1976)
28 years prior to MacLeamy, Barry Boehm drew a curve based on a pretty self-evident observation: a software project becomes more difficult to change the more developed it becomes. For this earth-shattering revelation Boehm named the curve after himself. It is pretty striking how similar the curves are, both in shape and even in what the axes signify. Boehm's curve is often used by software architects to justify upfront design - much like MacLeamy's curve is in architecture. However Boehm's curve has been challenged...
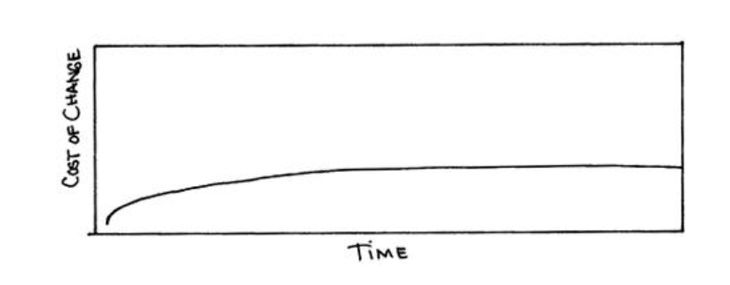
Beck's Curve (1999)
In his book 'Extreme Programming Explained' (1999) Beck drew a radically different version of Boehm's curve where cost approaches a horizontal rather than vertical asymptote. It is an audacious idea, but Beck thought it could be achieved by changing the culture of programming, moving away from up-front design and towards continuous design supported by a new generation of programming tools. 12 years later, we see evidence of Beck's curve manifesting. One example is Facebook, which somehow manages to run co-current versions, while they integrate new features, while changing the underlying infrastructure, while half a billion people visit the site, and all the changes happen on the fly, at a rapid pace, with no downtime. It would be like the designers of Boeing designing and changing the plane while it was flying. If Boehm's curve held true, the existing Facebook codebase would be growing exponentially more costly to change, slowing the rate of change. Instead, we see something resembling Beck's curve where the rate of change remains steady.
Beck's curve would never work in an architectural context because architecture, unlike software, is very difficult to change once it is constructed (although some cradle-to-cradle people might disagree with this). Significantly for architects, Beck's curve demonstrates the location of our design efforts do not need to be controlled by the cost curve. Instead, using new design tools and a new design culture, we can control the cost curve to suit our design efforts. So I propose another graph...
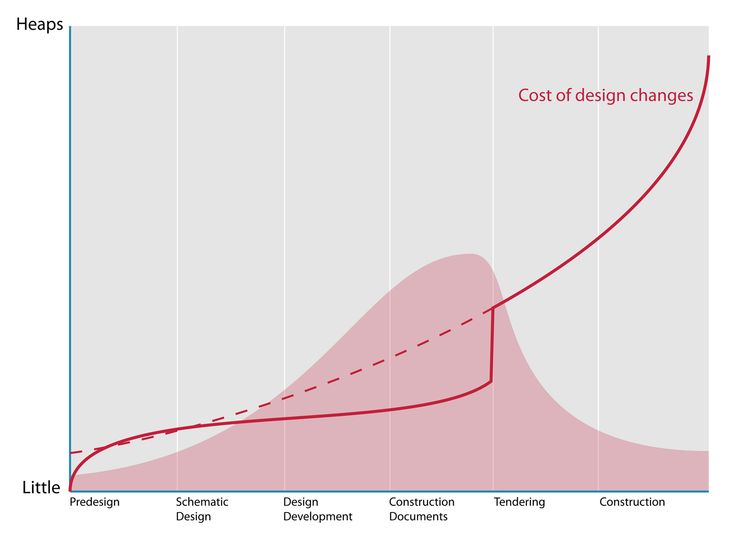
Davis curve? (2011)
This graph is based on the pretty self-evident observation: an architectural project is difficult to change once it is built but using flexible modelling tools, designers can delay finalising decisions until right before the moment of construction. For this earth-shattering revelation I have named the curve after myself. The curve is aspirational rather than reality since parametric modelling in contemporary practice still requires significant frontloading and still frequently encounters moments of inflexibility. The curve appears to be amplified by particular architectural typologies and for a few categories of problems, notably patterns and panels, the curve already exists. As parametric models become more supple, I think there is a possibility this curve could manifest on a wider range of design problems. You heard it here first.
I also note that while I have drawn this curve in terms of cost (to aid comparison with MacLeamy's curve) I think it is better stated in terms of flexibility. Cost is a measure of the designer's capacity to make a change, the designer's ability to design. Designers have more capacity to make change on a flexible model, while at the other end of the spectrum the designer has very little influence over a brittle model. Being able to change the design empowers the designer to explore the solution space, to reconsider the design problem and to respond when forces outside their control influence the project. While there is a cost associated with changing a design, flexibility aims to lower this cost by making designs more susceptible to change. That is why architects need flexible representations, why architects need parametric models.
25 October 2011: Another version of the graph based on suggestions in the comments. Perhaps we can call this one the Regnier curve :)
22 February 2012: It turns out Boehm's curve was originally published in: Boehm, Barry. 1976. “Software Engineering.” IEEE Transactions on Computers 25 (12): 1226-1241. I have amended the dates in the article from 1981 to 1976.
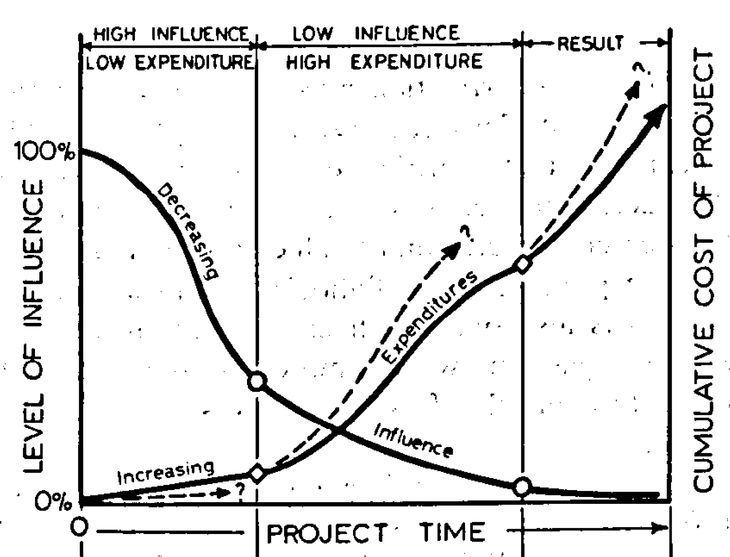
10 April 2012: Thanks to Noel in the comments, I have tracked the first instance of the MacLeamy curve down to a publication by Boyd Paulson in 1976: Paulson, Boyd C. 1976. “Designing to Reduce Construction Costs.” Journal of the Construction Division 102 (4): 587-592. Coincidentally Barry Boehm published his curve in the same year - but I am unsure if either author knew of the other.
Paulson's curve (1976)
Ben
A very well structured post, David. I commend you on what appears to be the decision to tackle some fairly enormous Issues with you thesis. I look forward to hearing about further developments. While the Davis curve is undoubtedly true for parametric components o current projects, I have noticed a nascent parallel trend in practice at the point of fabrication (or rather at the point of shop drawing generation. Agencies, consultants and fabricators are increasingly able to use direct model information in lieu of drawings. This lowers the cost of communication and allows the architect to spend more time in design, as well as (ostensibly) increasing accuracy. However, the process from the consultant or contractor side is usually pretty much the same-- architect models are rebuilt from the ground up to increase accuracy and account for the myriad concerns that a designer doesn't know or care about. Even if this process gets partially automated this results in a "baking" of the model at this point as fabricator models are so overloaded with information that they are resistant to change (think about how hard it is to get your rhino model into a usable file for 3d printing, but worse).
Ben
Ps don't know why I called you David in the above post. It's 7am here and I have a baby in my lap if that's any excuse.
Daniel
Hey Ben,
Well even without a baby it is an astute point you make. I think my assumption parametric modelling has no effect on the construction of architecture is clearly wrong – there are definitely both flow-on effects from using parametric models and advances in the construction of architecture. Not sure how the curve should look then because at some point in the construction, the building cannot be changed. Perhaps the linear sequencing of project developments is incorrect (significant Beck removed them all together). Reflecting on my own projects it is interesting to observe the construction phase is often a part of the design process with various construction techniques a prototyped and feed back into the design. In some ways this is like the Extreme Programming Beck is describing with faster, more frequent development cycles, which aid the programmer to reflect upon what is working and to embrace changes on the project.
Daniel
John H
The closest thing to the 'Davis curve' I can find is in this nice article which you may or may not have seen already by a chap named Scott Ambler: http://www.agilemodeling.com/essays/costOfChange.htm
Obviously, there isn't the large step at tender stage with his curve!
As a general comment, the main difference in building design to software is that due to costs we have to test with abstract simulations as opposed to real with people/weather/materials... but as this simulation technology becomes more realistic and rapid, the better it can be fed-back at the concept stage - however it must be remembered that some if not most qualitative things about how buildings interact with people just cannot be simulated or even known advance.
It's true that our current parametric technology allows us to extend this flexibility longer into the process... right up to tender in the ideal case as you point out, but I suspect there are alternatives to parametric modelling that allow for even better flexibility and a reduction in the amount of the frontloading required. Such a technology would be more analogous to XP whereby all user requirements & constraints are up for grabs .... well, that's my dream to find one anyway!!
Thank you for this excellent post.
Federico
This is a really interesting topic of research and one that deserves a lot more attention. Look forward to seeing more of your findings... One aspect I would be curious to hear your thoughts on would be the clear differences that each of these industries (software and building) have in as far as the element of time. The example you use with Facebook exists under the clear benefit of 'real time' feedback. Elements and ideas can be tried, tested on real users, analyzed, updated, implemented, shelved, etc... Architecture lacks this 'user testing' capability, at least in its current state. I believe this probably opens the door to some study of the use of 'design patterns' in web development, and why these are not used more often in architectural design... Can some aspect of user testing be used in architecture as a tool to lower risk, and thus cost to implement the change? Are strategies like the use of design patterns or user testing viewed as counter to architectural innovation? Do they represent a completely different paradigm that isn't applicable in buildings?
Ben
Federico,
The idea of "patterns" actually originated in archtiecture, the term being coined for that purpose by Christopher Alexander more than forty years ago, and elaborated on in his book "A Pattern Language." Alexander first went to Cambridge University to study computer programming, but was drawn to architecture and became part of what was arguably the first computational design program, at CU. He rubbed shoulders there with Peter Eisenmann, who would form a fundamentally different view of the role of computation and architecture, one that (unfortunately in my view) proved more popular in the last twenty-odd years of architectural education. Meanwhile, computer programmers picked up the concept of "patterns" wholeheartedly and ran with it. My reaction to this saga (beyond viewing it as a tremendously entertaining debate that should be a central part to any history of contemporary design), is that while Alexander may have attempted a flawed implementation of architectural patterns, one that reduced the role of archtiectural novelty and innovation and was largely for this reason unpalatable to his colleagues, the fundamental concept is a great one that deserves further study.
Federico
Thanks Ben, I agree with 'unfortunately'. :)
I have read up on Alexander a bit, but mainly through the eyes of the people that put together Yahoo's design pattern library. They describe the concept of their work with a basis on Alexander's research. Very interesting, I recommend it...
In any case, I agree also that it deserves further study and would ask if the concept may have been taken too literally at the time? Could it be that the tools we have today (including all out programming) would allow us to implement a pure interpretation of design patterns without compromising contemporary aesthetics? Are we there? Is anyone researching this? Would be really interesting to test out...
Ben
If you want some history of the architectural beginnings of things, Sean Keller has done some great work at Harvard and MIT researching the early history at Cambridge University (a good start is his article "Fenland Tech" in Grey Room http://www.mitpressjournals.org/toc/grey/-/23. There are a lot of work by Woodbury et al on patterns in computational design, an idea that some people seem to be doing further work on. Personally I think that breaking down computational methods into patterns is a fantastic idea that helps to make computational design strategies more explainable and replicable, but I still haven't seen a truly convincing use of patterns in design in general, and we may never see such a thing - after all, even in programming patterns are largely used in implementation, and rarely in concept. I would hesitate to use the word "pure" in this context as well given that there is a great deal of disagreement as to what "good design" truly is - one of the real problems with architectural optimization is an almost complete inability to come up with useful, simple metrics to use as a basis for cost or benefit. My question is, in the context of design, what is the difference between a pattern and a rule of thumb? How would a design pattern be expressed simply, without recourse to examples? And how big or small are the irreducible parts of a design?
Daniel
An important point made by the Gang of Four in 'Design Patterns' is that "one person's pattern can be another person's primitive building block." So a pattern can exist at a variety of scales, contexts and abstractions.
I agree with Ben that computational patterns in parametric models seem to be a viable way to reduce rework in architectural projects. In addition to Ben's examples I would suggest that detail libraries used by firms perhaps constitute a pattern, albeit of a different scale and context to a model pattern. Firms often become quite attached to their library details, since they represent a collection of verified solutions to reoccurring problems. It seems design patterns are a related concern of knowledge capture.
Sivam Krish
Excellent post. Very good understanding. Phd should be a breeze. Your difficulty will be getting the right examiner who has the level of understanding that you have on this one.
:)
I have discussed this curve and its relevance in the context of cloud computing.http://generativedesign.wordpress.com/2011/10/25/whatz-the-clouds-got-to-do-with-it/
In discussing cost, it will be good idea to separate cost of time into various professions and levels of expertise. Conceptual design is usually done by lead architects whose time is more valuable than drafts persons cranking out stuff at the latter stages..
Daniel
Hi Sivam,
I wanted to attend your seminar on ‘The Cloud’ but 4am was too early for me. Don’t know how you managed to get up and function then!
A similar issue about the cost came up when I showed them at RMIT. I am thinking it might be better to frame them in terms of design potential. The diagrams won’t be central to my argument, more a way to guide people into my thinking about how we can make the design process more flexible by borrowing methods from computer scientists.
Daniel
Sivam Krish
Daniel,
Not only do we need to borrow, but need to base our discussions on design technology on computer science - when it comes to search, process and performance issues. As ways of thinking and quantifying issues are very well developed in computer science.
There are however some significant differences between software constructions and design constructions even though designs are now essentially pieces of software. A major one that is relevant to what your are analyzing is that software that operates web platforms are architectural from day one for evolution where buildings are architecture is not. So that is why the cost of change is flat fro software. So it is part of the design intent to keep the tail end flat.
However, you have jumped into a great area poorly explored by design theorist. I look forward to its evolution. I will be following it with keen interest.
The lecture on the cloud will be on public domain in three months. I made similar observations about "front loading", that is now the focus of most CAD companies because that is where significant can be made.
Keep up the good work.
Noel
I do not think that Mr. MacLeamy's curve provided, how did you put it, "an earth shattering revelation." First of all, MacLeamy was not so original. He may have added a line or two to make the chart his own (so he could name it after himself, I suppose), but check this out. The primary portion of the curve was developed by Boyd C. Paulson, Jr., M.ASCE, (Prof., Dept. of Civil Engrg., Stanford Univ., Stanford, Calif.) Go to this webiste: http://pmbook.ce.cmu.edu/02_Organizing_for_Project_Management.html and then check out Figure 2-3: Ability to Influence Construction Cost Over Time.
Daniel
That is a really valuable piece of information Noel, something that would otherwise quite easily be forgotten in time. Thank you. I have amended the main blog post and I am amending my PhD as we speak! Will also take a look through Paulson's Professional Construction Management when I am next at the library. Thank you once again.
Daniel.
Rudd va Deventer
Hi Daniel, after a long period on both sides of the fence I must agee with Noel and the issue of ablity to influece the final cost. This is not new, that said, Macleamy has focused on a soluton for clients and designers. Think about what you want upfront, as early as possible, lock down the requirments and keep communicaton channels between the designers and the tenant team open. In my experience the client does not spend enough effort to get the brief ready as early as posible to their own detriment! There is a mistaken belief with clients that things can be changed easily - as long as it has not been built on site. This must be dispelled!
Daniel
Hi Rudd,
In your experience what is the best way to lock the requirements down? I have seen some specialists who work on behalf of the client to write the brief, or is this just a matter of the architect communicating to the client early on the value of clarity, or do you think a structural reorganisation like IPD is needed?
In my experience, which is admittedly decades less than yours, clients often don't quite know what they are asking for until they see it. This is not to say we shouldn't try to lock stuff down, but I think it is inevitable clients change their minds, or the council changes their minds, or the price of steel changes, and architects are left to deal with these shifting requirements.
Sivam krish
The trick is to keep the design in jelly form as long as you can. But then you wont have the final drawings ready for construction - unless the rest of the boring stuff is procedurally accomplished.
Mark
Has anyone ever determined the real cost (simply because value is harder to track) of the different types of changes that various stages could include?
Design changes - Strategic Brief, Brief, Concept design, Developed design, Technical design, Tender
Rework of built fabric/services - Construction, Hand over, (cost may include delay to completion)
Alterations to fabric/services - In use (including cost of disruption to operations)
If the magnitude of cost could be more clearly stated then this would be of practical value. (Cost of one concept drawing, ten detailed design drawings, 30 construction details, a built item etc.)
Are there any case studies that demonstrate whether or not these curves - for building processes - exist in reality? (What are the real shape of the curves?)
Daniel
Hi Mark, As far as I'm aware, no one has actually calculated the cost of the curve for architects. Intuitively we know the endpoints of the curve are in the right place but there is no way to know the exact shape. In the field of software engineering there has been some historic work done by Barry Boehm (1981) to calculate the shape of the curve: https://www.danieldavis.com/thesis-ch3/#1 His research shows an exponential curve where it is roughly 100 times more expensive to change a project at the start compared to the end. Of course, methods of software engineering have changed and this no longer holds true. And software engineering is not necessarily an analogy for architecture in this situation given the differences in products and costs. So in short, the Macleamy curve should be treated as a diagram rather than a statement of fact.
Mark
The point of greatest influence and lowest expenditure is during brief development. Historically architects tend to rush into design because it's the subject they trained to do - and enjoy. (I know, I am an architect.)
Creating more thorough brief development tools and techniques is what needs to be done. (It has little to do with BIM - other than the fact than BIM is a good way of storing the brief.)
Have a look at "Assessing Building Performance" Wolfgang Prieser et al. As this book considers the feedback loop in buildings and building design it could play an informative role in developing an understanding of the curves and how they may be influence.
P.S. Great observations by the way.
Daniel
I'll take a look at the Wolfgang book, thanks for the reference. My only concern about spending more time on the brief is that we do not necessarily know the full scope of the project before we start the design. It might only be through designing that we learn the client doesn't like the color red. So in some ways I think doing design is an important part of developing the brief. Which of course makes everything messy!
Mark
Design will always be iterative. But there is scope for refinement of the brief prior to design. This can lead to a more controlled design process wih less iteration.
lawrence
For simple cost calculations
Let us say Concept stage error for sizing of 10 transformer substations - cost USD 1000 to rectify calculations and architectural sketches
Same error will cost you USD 10,000 at schematic stage because now you have calculations/analysis to be re done and drawings to revised for say 3 disciplines.
Same error will cost you USD 100,000 at detailed design and tendering stage because now you have to revise a lot of layout and detail drawings including specifications and tender documents, extension of tendering period etc.
Same error can cost you USD 1,000,000 at construction stage due to change order time and cost claims and revisions on the trenches, civil works cabling etc
Depending on the facility same error can cost you couple of USD millions during occupation stage.
Daniel
These calculations make sense intuitively but I still think there is the potential to manipulate these numbers. If you are using a parametric model, perhaps the cost of change in the schematic stage is significantly less because there is a parameter for transformer substations. Changing this parameter automatically updates the calculations and drawings with very little work required from anyone else. It gets more difficult to change things made of concrete, but even in the occupation stage it may still be possible to make more modifications to architecture if the architecture is increasingly being augmented by digital systems.